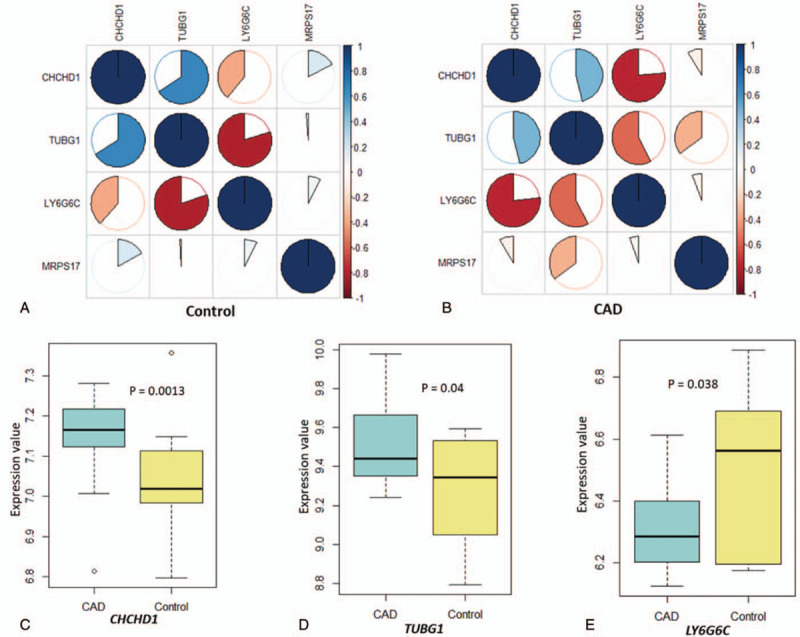
Figure 5.

Significant differences in the expression signatures of four identified genes between CADs and controls. (a) Co-expression patterns of four identified genes in the control group based on Pearson correlation analysis. (b) Co-expression patterns of four identified genes in CAD group based on Pearson correlation analysis. (c-e) Boxplots show the significantly differential expression patterns of 3 identified genes between CAD and control groups. (c) CHCHD1, (d) TUBG1, and (e) LY6G6C.
