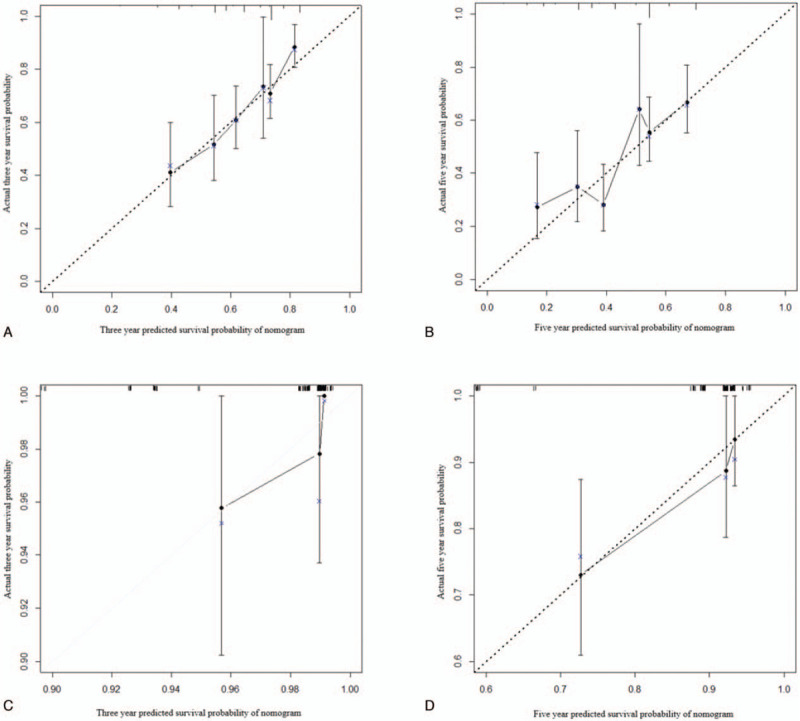
Figure 3.

Calibration curves of the nomogram predicting 3-year overall survival and 5-year overall survival for both training and validation cohorts. (A) Calibration curve of nomogram predicting 3-year OS for the training cohort. (B) Calibration curve of nomogram predicting 5-year OS for the training cohort. (C) Calibration curve of nomogram predicting 3-year OS for the validation cohort. (D) Calibration curve of nomogram predicting 5-year OS for the validation cohort. Calibration curves describe the calibration of developed nomogram in terms of the agreement between the predicted 3-year and 5-year OS and observed 3-year and 5-year OS. The y-axis represents the actual OS. The x-axis represents the predicted OS. The line derived from the function y=x represents a perfect prediction by an ideal model. The dotted line represents the prediction performed by this nomogram, which indicate a better prediction when it fits closer to the diagonal line.
