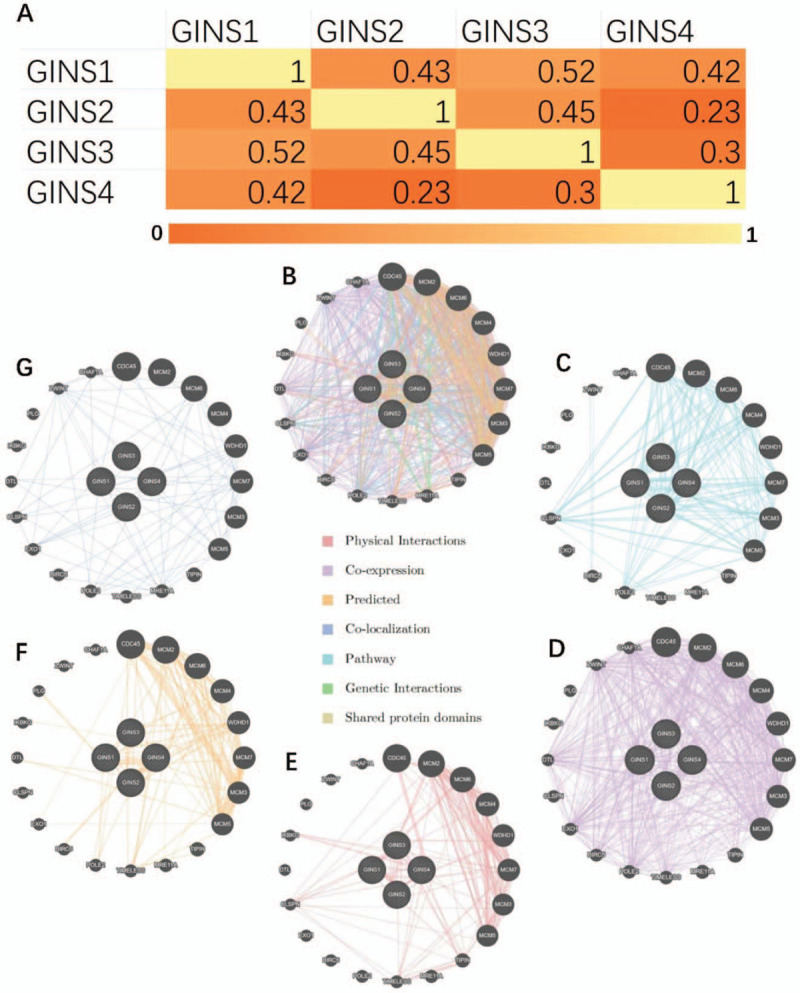
Figure 4.

The correction between each GINS subunit and Interaction analysis of GINS subunits in breast cancer. (A) Heatmap of the correction between GINS subunits in breast cancer. (B) Gene–gene integrated interaction network among GINS subunits. (C) Pathway. (D) Co-expression. (E) Physical interaction. (F) Predicted interaction. (G) Co-localization.
