Figure 5.

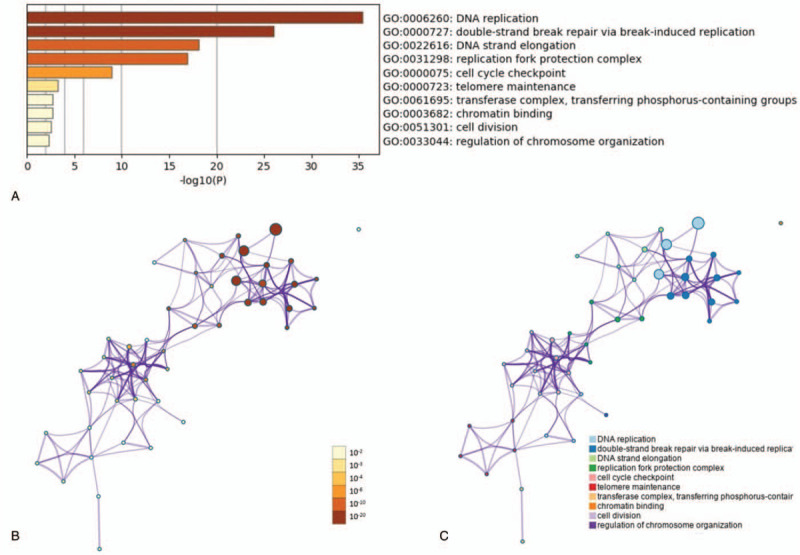
The enrichment analysis of the GINS subunits and neighboring genes in breast cancer. (A) Heatmap of Gene Ontology (GO) enriched terms. B-C, Network of enriched terms: (B) colored by P value (C) colored by enriched terms.

The enrichment analysis of the GINS subunits and neighboring genes in breast cancer. (A) Heatmap of Gene Ontology (GO) enriched terms. B-C, Network of enriched terms: (B) colored by P value (C) colored by enriched terms.