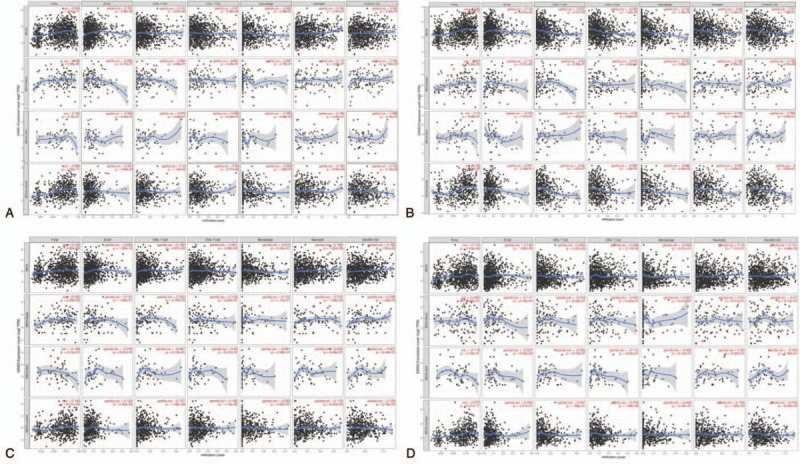
Figure 6.

Correlation between GINS subunits expression and immune infiltration levels in breast cancer. Scatter plots showed the correlations between (A) GINS1, (B) GINS2, (C) GINS3, (D) GINS4 expression and immune infiltration levels in different subtypes of breast cancer.
