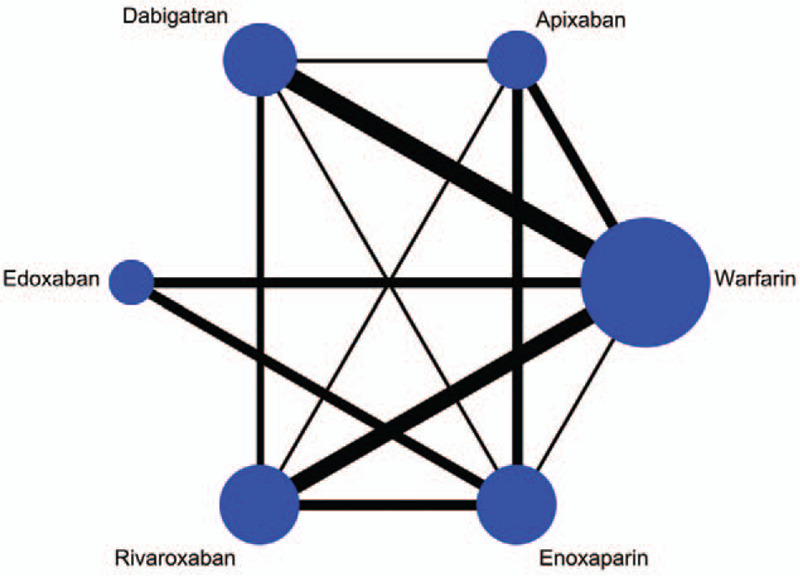
Figure 2.

Network plot depicting the direct evidence used in the network meta-analysis. The widths of lines for each connection in the evidence network are proportional to the number of randomized controlled trials comparing each pair of treatments and the circle size is proportional to the number of patients.
