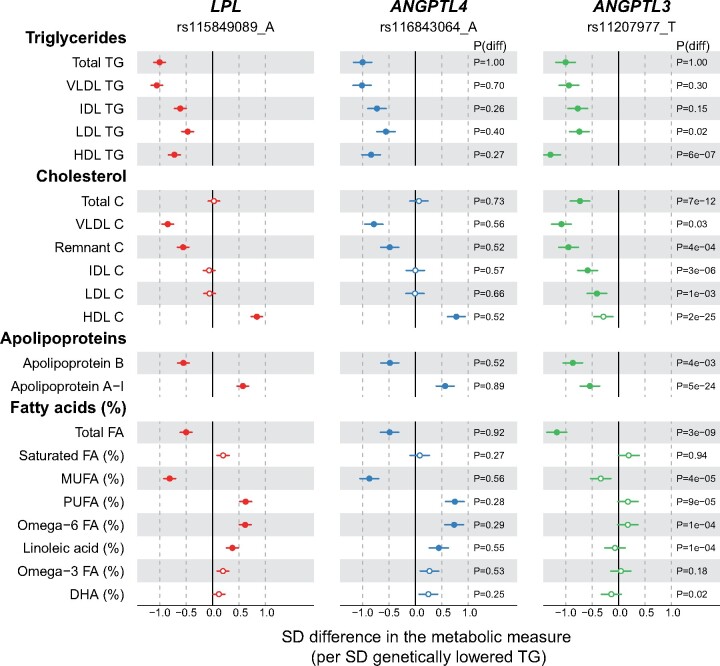
Figure 1.
Associations of LPL (red), ANGPTL4 (blue), and ANGPTL3 (green) genotype with lipoprotein lipids and fatty acids. The associations were scaled so that each genotype is associated with 1-SD (∼0.55 mmol/L) lower concentration of triglycerides. The associations were meta-analysed across six population cohorts, up to 61 240 participants. P(diff) denotes the P-value for the comparison of the metabolic associations of ANGPTL3 (or ANGPTL4) with those of the LPL genotype. Closed symbols: P < 0.0002; open symbols: P ≥ 0.0002. C, cholesterol; DHA, Docosahexaenoic acid; FA, fatty acids; HDL, high-density lipoprotein; IDL, intermediate-density lipoprotein; LDL, low-density lipoprotein; MUFA, monounsaturated fatty acids; PUFA, polyunsaturated fatty acids; TG, triglycerides; VLDL, very-low-density lipoprotein.

