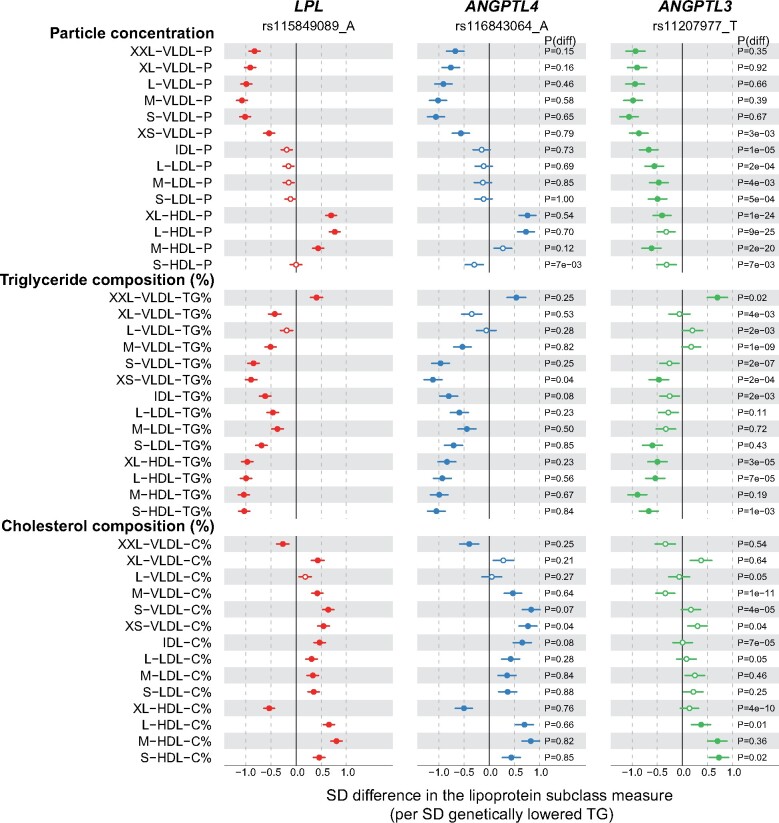
Figure 2.
Associations of LPL (red), ANGPTL4 (blue), and ANGPTL3 (green) genotypes with the lipoprotein lipid compositions. Analyses details are as in Figure 1. TG% refers to the triglyceride concentration relative to total lipids within a single lipoprotein particle. Similar definition applied to C%. Closed symbols: P < 0.0002; open symbols: P ≥ 0.0002.

