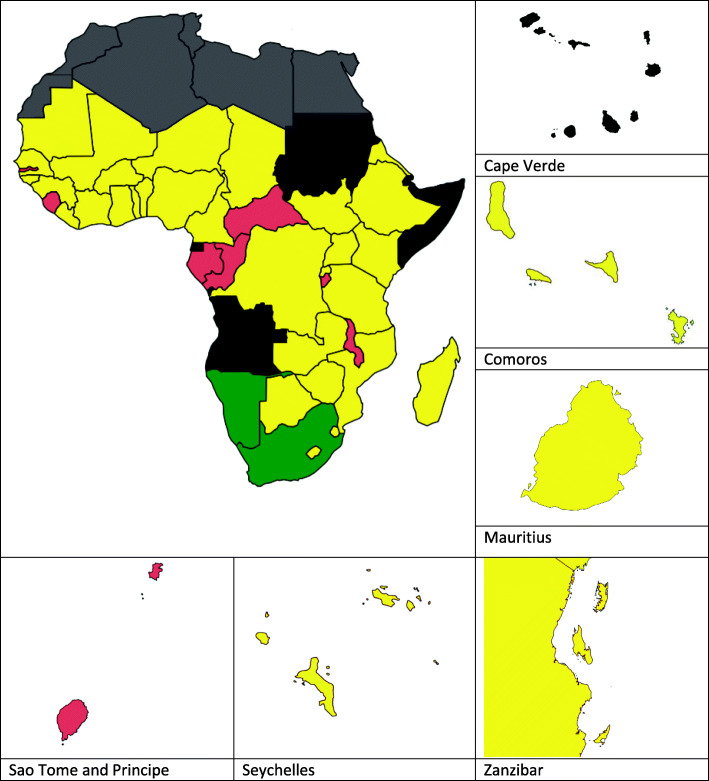
Fig. 1.
Map showing SSA country mean zoonotic disease preparedness scores. Red = a score of 1 (‘no capacity’). Yellow = 2 or 3 (‘limited or developed capacity’) and green = a score of 4 or 5 (‘demonstrated capacity’ or ‘sustainable capacity’). Countries that have not completed a JEE report are shown in black and North African countries not included in this review are coloured grey. For the countries included in this study, please see [27]

