
Figure 1.
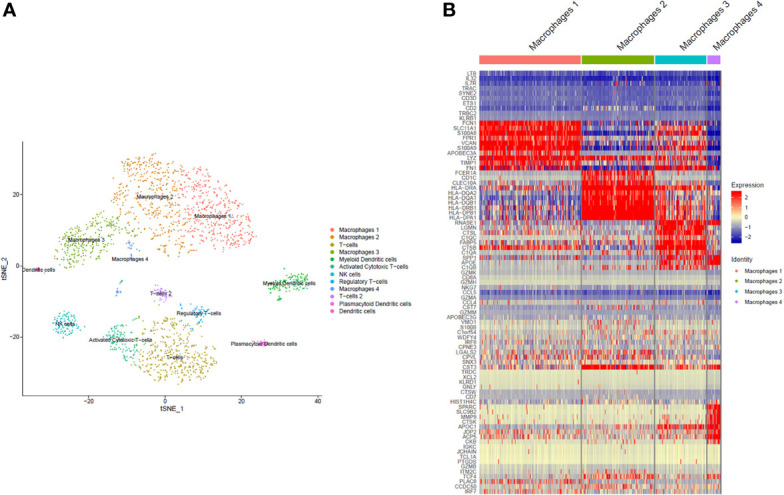
Single cell RNA sequencing. The clustering of predicted cell subpopulations from SF cells of 3 PsA patients identified 12 different cell populations, with the most dominant being monocytes/macrophages (A). The monocytes/macrophages were comprised of four subpopulations, three of which were large (macrophages 1, 2 and 3) with expression levels of unique cell markers and transcriptomic signatures. The expression of top differentially expressed genes within the monocyte/macrophage subpopulations is shown in (B).