Figure 5.
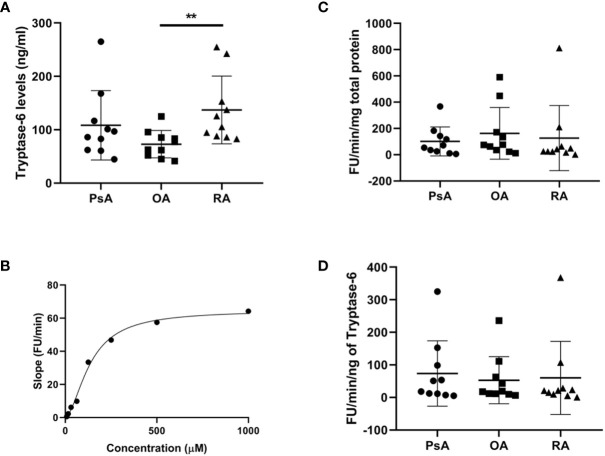
Total and active tryptase-6 levels detected in SF from PsA, OA and RA patients. Total and active tryptase-6 levels were determined by a commercially available ELISA and a pull-down activity assay, respectively in PsA, OA and RA SF samples (n=10 per group). As shown in (A), total levels of tryptase-6 were elevated in RA (median 115.6 ng/ml, range 87.6-175.5) compared to OA SF (median 70.08 ng/ml, range 50.3–87.9, p=0.002, Mann Whitney U test). The activity of pulled down-tryptase-6 from PsA SF towards VPR-AMC generated the substrate cleavage curve shown in (B). Tryptase-6 activity from SF samples, after normalization to either total protein levels (C) or total tryptase-6 (D), did not reveal any significant differences between groups. Asterisks are used to indicate significant differences between groups, where **p<0.01.

