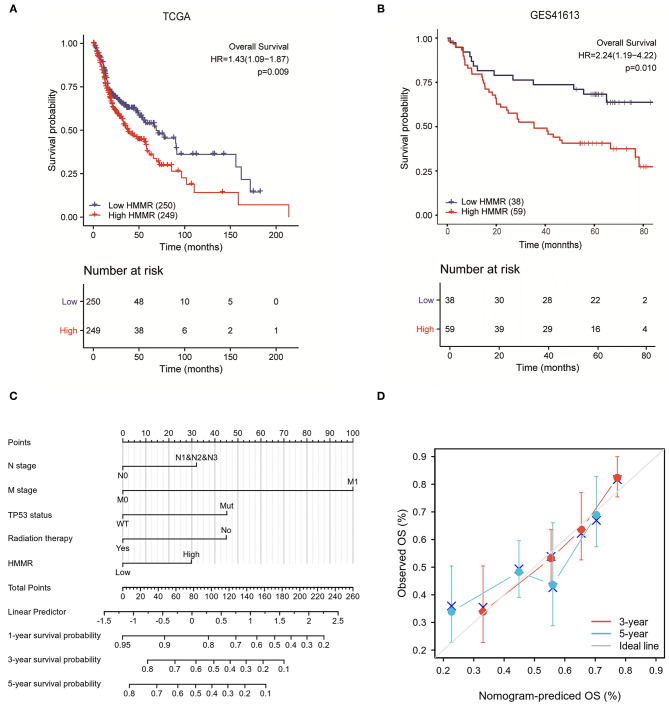
Figure 2.
The prognostic value of HMMR expression in HNSCC. (A) Survival curves of OS from TCGA data (n = 500); (B) Survival curves of OS from GSE 41613 data (n = 97); (C) A nomogram that integrates HMMR and other prognostic factors in HNSCC from TCGA data; (D) The calibration curve of the nomogram.

