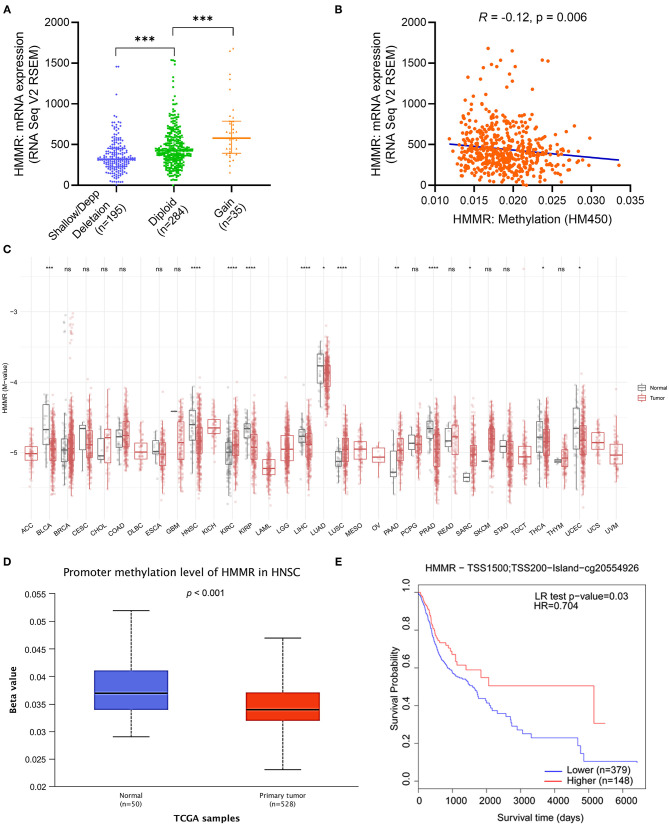
Figure 3.
The copy number variation (CNV) and methylation of HMMR in HNSCC. (A) the expression level in different CNV of HMMR (n = 514); (B) the correlation between HMMR methylation and its expression level (n = 521); (C) The methylation levels of HMMR in pan-cancer and normal tissues from TCGA data; (D) The promoter methylation of HMMR in tumor tissues (n = 528) and normal tissues (n = 50) from TCGA-HNSCC data; (E) the Kaplan–Meier survival of the promoter methylation of HMMR in HNSCC (n = 527). *p < 0.05, **p < 0.01, ***p < 0.001, ****p < 0.0001.

