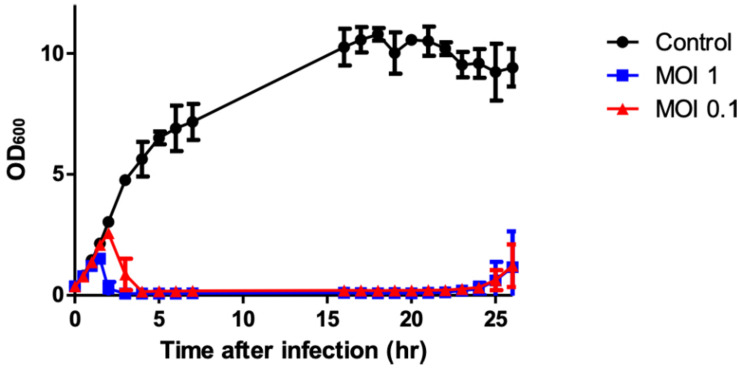
FIGURE 2.
Bacterial growth inhibition assay against S. aureus. Cells were prepared in three groups: the control group without phage (∙) and the experimental group with phage (■, ▲; MOIs of 1 and 0.1, respectively). The data shown are the mean values from three independent measurements, and the error bars represent the standard deviations.

