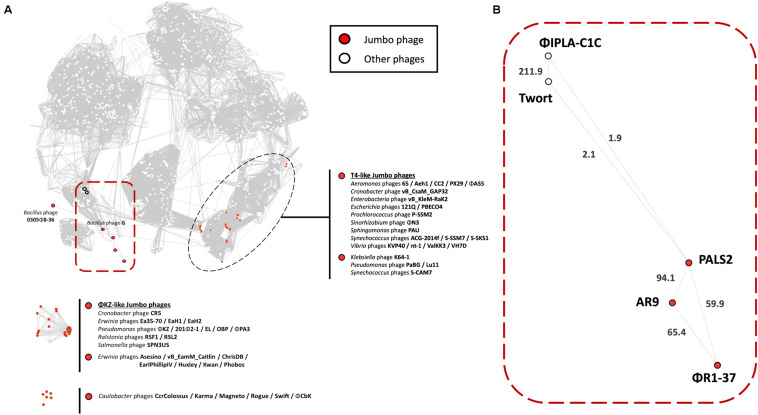
FIGURE 6.
Protein-sharing network of phage PALS2. (A) A network representation was produced using Cytoscape. Nodes indicate phage genomes, and edges between two nodes indicate their statistically weighted pairwise similarities with phage–phage similarity scores of ≥1. Nodes are colored according to the phages’ characteristics: jumbo phage, red; other phages, white. Jumbo phages were further labeled with their designated names. On the top is the largest subnetwork that contains the largest number of phage genomes, including jumbo phages from the T4-like clade. The other subnetworks below are the smaller clusters of jumbo phages and their relatives that were disconnected from the largest subnetwork. Phage PALS2 and its first neighbors are situated in the large subnetwork, which is highlighted with a red square boundary. (B) Enlarged view of phage PALS2 and its relatives. Edge length is proportional to the similarity values estimated with the hypergeometric equation. The values are written on top of each edge. The data indicate that PALS2 is closer to jumbo phages AR9 and phiR1-37 than to the staphylococcal phages Twort and phiPLA-C1C.

