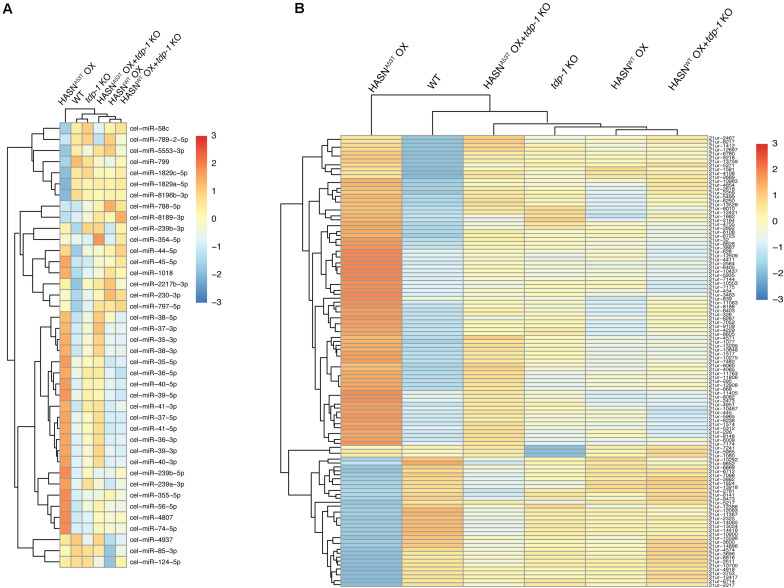
FIGURE 1.
Hierarchical clustering for DE-miRNAs (A) and DE-piRNAs (B) of mutant/transgenic strains compared with WT strain. The cutoff of DE-miRNAs was p < 0.05 and absolute fold change >2; DE-piRNAs were p < 0.01, FDR < 0.1, and absolute fold change >2. The logarithmic scale represents the range of expression values of DE-miRNAs/DE-piRNAs. The top cluster dendrogram indicates the similarity of different strains based on the average expression values of all DE-miRNAs/DE-piRNAs of each strain. The left cluster dendrogram indicates the similarity of different DE-miRNAs/DE-piRNAs based on the average expression values of each DE-miRNA/DE-piRNA of all strains. The right colored bars show the DE-miRNA/DE-piRNA expression values.

