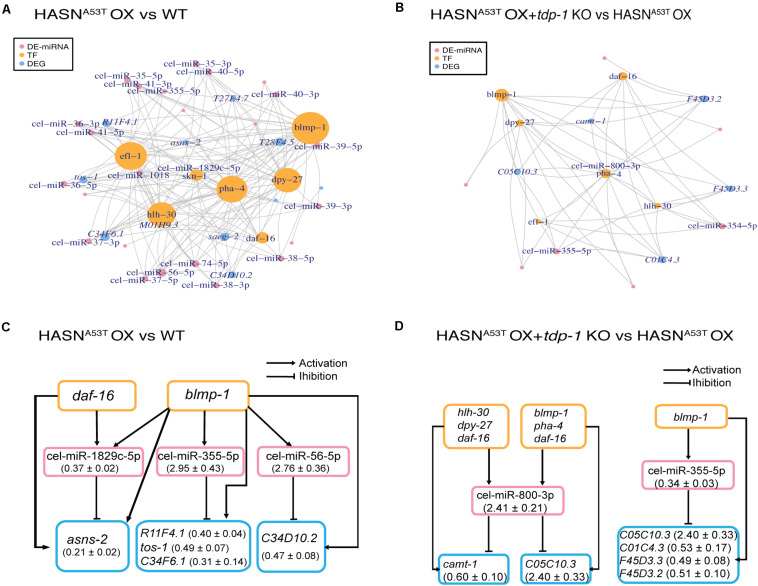
FIGURE 5.
Networks of DE-miRNAs, DEGs (differentially expressed genes), and TFs (transcription factors). We obtained networks for only two comparisons: HASNA53T OX vs WT and HASNA53T OX + tdp-1 KO vs HASNA53T OX. DEGs were generated from the RNA-Seq of the same strains in our previous work with the cutoff of p value <0.05 and absolute fold change >2 (Shen et al., 2020). (A,B) Pink nodes represent DE-miRNAs. Orange nodes represent TFs. Blue nodes represent DEGs. The node size represents the node degree. Nodes labeled are the ones with a node degree >3. TFs were written as a vertical word in order to distinguish it from DEGs in these figures. (C,D) The pink rectangles indicate DE-miRNAs. The orange rectangles indicate TFs. The blue rectangles indicate DEGs. Fold change (mean ± SEM) of DE-miRNAs and DEGs are indicated in the parentheses.

