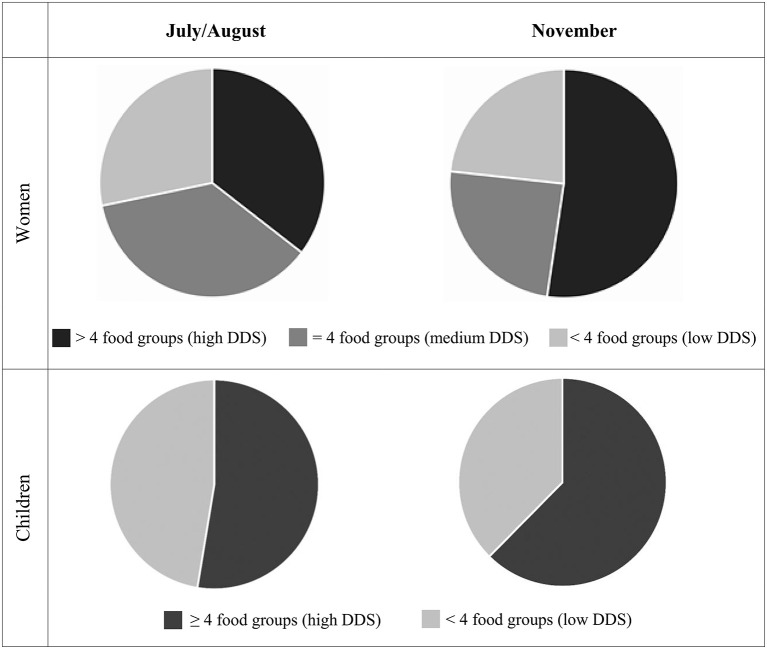
Figure 2.
Distribution of Dietary Diversity Scores (DDS) and proportion of women (n = 426) who had diets with low (<4 food groups), medium (=4 food groups) and high (>4 food groups) DDS and children (n = 426) who consumed diets with high (≥4 food groups) and low (<4 food groups) dietary diversity and in July/August and November 2012.

