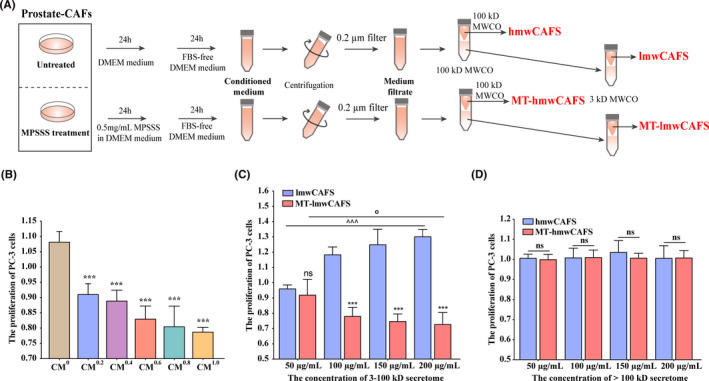
FIGURE 1.

The effect of lmwCAFS and MT‐lmwCAFS on PC‐3 cells. (A) The workflow for collecting high molecular weight and low molecular weight secretome of prostate CAFs untreated/treated with MPSSS. (B) PC‐3 cells were exposed to CM0, CM0.2, CM0.4, CM0.6, CM0.8, and CM1.0 and fresh DMEM (v/v = 1:1) for 24 h. n = 4 biological replicates, ***p ≤ 0.001: PC‐3 cells treated with CM0.2, CM0.4, CM0.6, CM0.8, and CM1.0 compared with PC‐3 cells treated with CM0, respectively. (C) PC‐3 cells were exposed to lmwCAFS and MT‐lmwCAFS (3‐ to 100‐kD secretome) with final protein concentrations of 50, 100, 150, and 200 μg/ml for 24 h. n = 4 biological replicates, ns and ***p ≤ 0.001: PC‐3 cells treated with MT‐lmwCAFS compared with PC‐3 cells treated with lmwCAFS. ^^^ p ≤0.001: PC‐3 cells treated with lmwCAFS. °p ≤0.001: PC‐3 cells treated with MT‐lmwCAFS. (D) PC‐3 cells were exposed to hmwCAFS and MT‐hmwCAFS (>100‐kD secretome) at final protein concentrations of 50, 100, 150, and 200 μg/ml for 24 h
