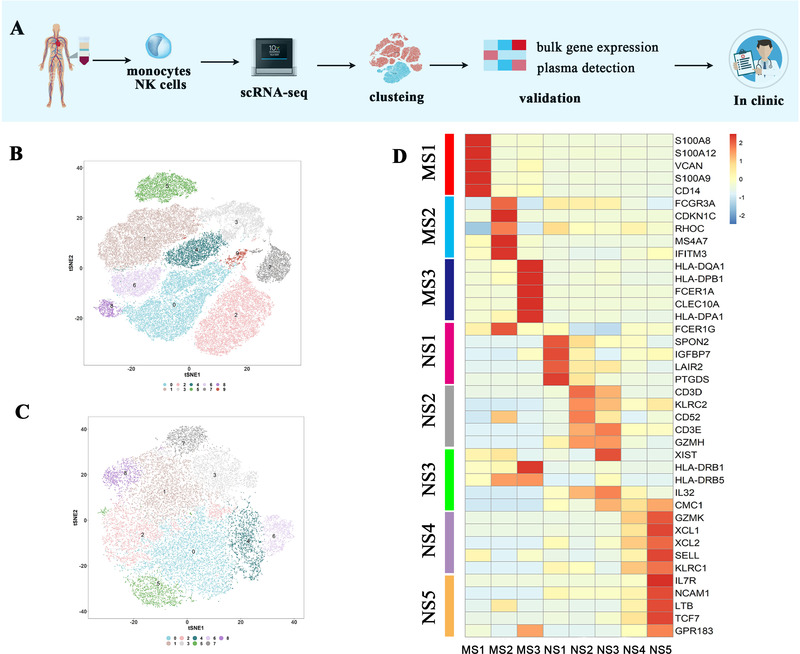
FIGURE 1.

Donor characteristics and analysis strategy. (A) Processing pipeline of blood samples from AS patients and healthy controls. Monocytes and NK cells were separated from other peripheral blood mononuclear cells (PBMCs) by antibody‐coated beads, and subsequently loaded onto the 10× scRNA‐seq platform. (B and C) tSNE plot for monocytes (n = 49.8 × 10³) and NK cells (n = 26.2 × 10³) showing different clusters. (D) Heatmap of selected markers revealed the differential expression profile of each cell state (false discovery rate [FDR] < 0.05)
