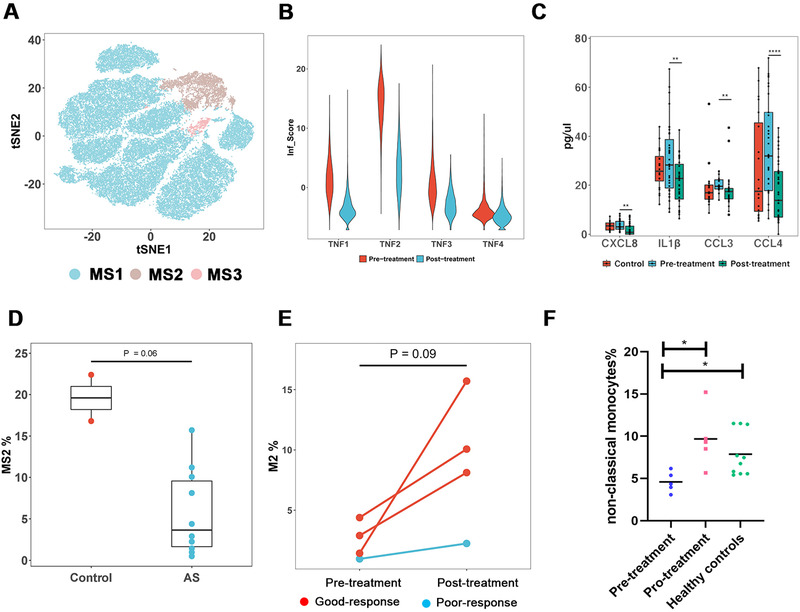
FIGURE 2.

Characteristics of monocytes in AS patients. (A) tSNE plot showing three monocyte states (MS1, MS2, and MS3). (B) Inflammatory score (Inf_Score) defined by the expression of eight genes (CCL4L2, CCL4, CXCL8, CCL3L1, IL1B, CCL3, FOS, and TNF) of four AS patients treated with etanercept. The Inf_Score decreased drastically after treatment. (C) Detection of plasma cytokines in controls and patients pre‐ and posttreatment with our four‐cytokine panel including CCL3/CCL4, CXCL8, and IL1β. (D) Comparison of the relative proportion of MS2 cells between AS and healthy controls. (E) Variation of the relative proportion of MS2 after treatment with etanercept. The red pots presented patients with good response to etanercept, whereas blue ones presented patients with poor response. (F) Validation of monocyte signatures associated with TNF blockade by flow cytometry
