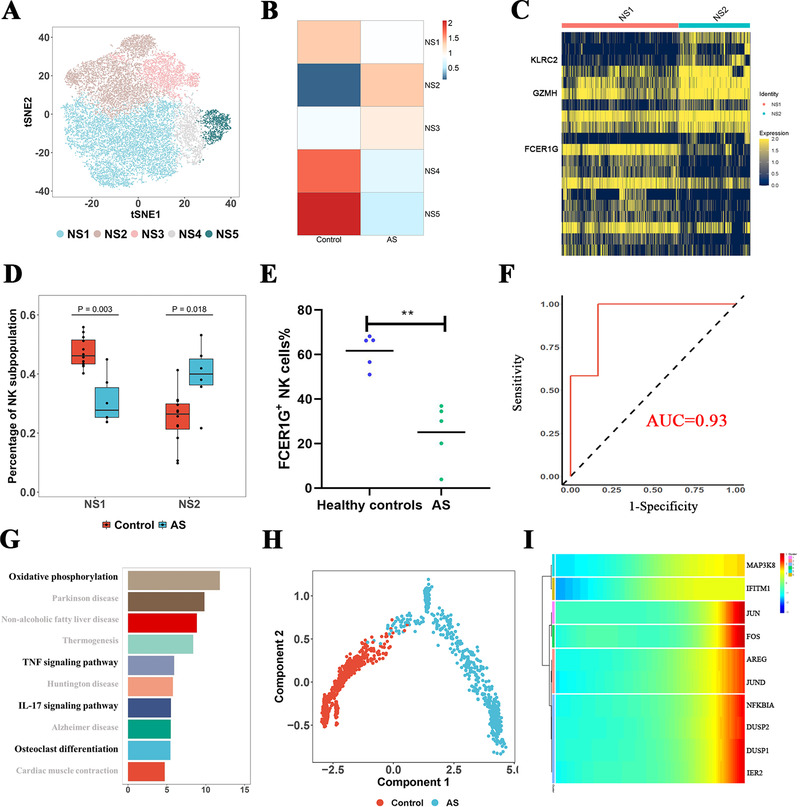
FIGURE 3.

Characteristics of NK cells in AS patients. (A) tSNE plot showing five NK cell states (NS1, NS2, NS3, NS4, and NS5). (B) Scaled distribution of subgroups of NK cells in AS patients and healthy controls. (C) Heatmap plot showing gene expression in NS1 and NS2 subsets. Three genes including KLRC2, GZMH, and FCER1G showed high difference between NS1 and NS2. (D) Validation of NS1 and NS2 proportions in AS patients and healthy controls by deconvolution analysis after bulk RNA sequencing. (E) Flow cytometry staining with CD56, and FCER1G in AS patients and controls. (F) Receiver operating characteristic (ROC) curve of NS1 as discriminator of AS patients and healthy controls. (G) Pathway enrichment analysis (KEGG) of genes differentially expressed between AS patients and controls. Pathways highlighted with bold fonts played an important role in the pathogenesis of AS. (H) Trajectory analysis of NS4. (I) Key genes associated with the pseudo‐time of NS4. Data of NS5 are shown in Supporting Information figures
