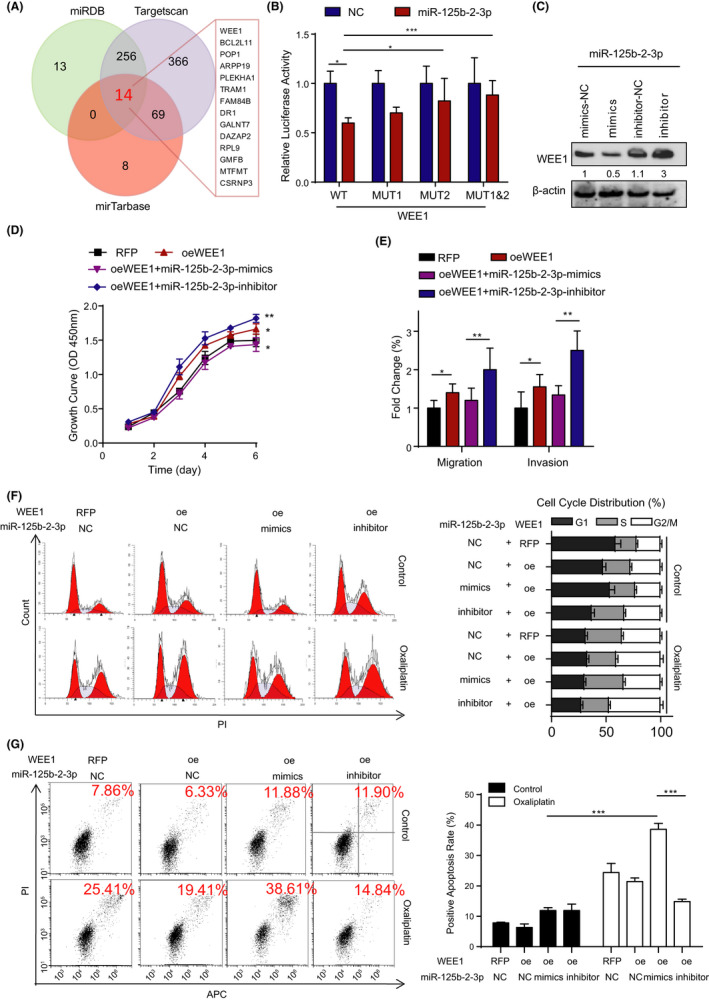
FIGURE 4.

MiR‐125b‐2‐3p exerts its function by influencing the target gene WEE1. (A) Venn diagram showing the overlap among the target genes from miRDB, TargetScan, and miRTarBase. (B) Luciferase reporter assay shows that miR‐125b‐2‐3p significantly decreased the luciferase activity in WEE1‐WT but not in WEE1‐Mut2 and WEE1‐Mut1&Mut2 in HCT116 cells. (C) Western blot of WEE1 in the total lysates of HCT116 cells transfected with the miR‐125b‐2‐3p mimic, inhibitor or control siRNA. (D) The cell proliferation was measured in HCT116 cells transduced with WEE1 lentivirus and the mimic or inhibitor of miR‐125b‐2‐3p. (E) Representative images (left) and quantification (right) of the migration and invasion assays of the CRC cells transduced with WEE1 lentivirus and the mimic or inhibitor of miR‐125b‐2‐3p. (F) Representative images (left) and quantification (right) of the cell cycle in the CRC cells transduced with WEE1 lentivirus and the mimic or inhibitor of miR‐125b‐2‐3p treated with or without 10 µM oxaliplatin for 48 h; the cell cycle was determined using the flow cytometry. (G) Representative images (left) and quantification (right) of cell viability in the indicated cells transduced with WEE1 lentivirus and the mimic or inhibitor of miR‐125b‐2‐3p treated with or without 30 µM oxaliplatin for 48 h; cell apoptosis was determined using the flow cytometry. Data are presented as the mean ± SD. (n = 3). * p < 0.05 or ** p < 0.01 versus the control
