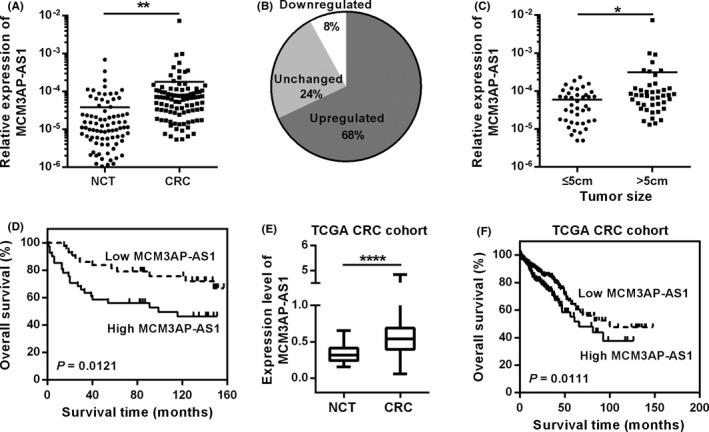
FIGURE 1.

Up regulation of MCM3AP‐AS1 indicates poor clinical outcome in CRC. (A,B) RT‐qPCR was used to detect the relative expression of MCM3AP‐AS1 in CRC tissues and NCTs. (C) The expression of MCM3AP‐AS1 was related to tumor size. (D) Kaplan–Meier survival analysis of CRC patients with different expression level of MCM3AP‐AS1. (E) The expression level of MCM3AP‐AS1 in TCGA CRC dataset. (F) The Kaplan‐Meier curve of MCM3AP‐AS1 of CRC in TCGA database. *p < 0.05, **p < 0.01, ****p < 0.0001.
