
FIGURE 2.
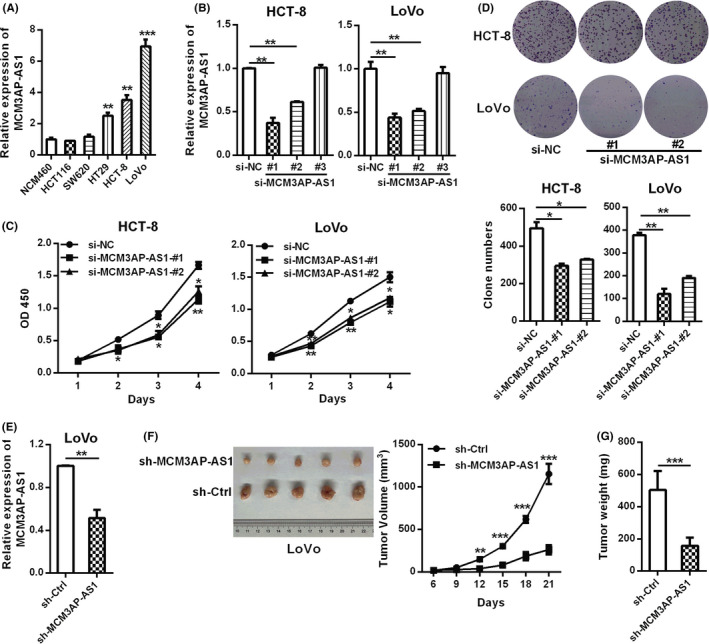
MCM3AP‐AS1 promoted CRC proliferation. (A) RT‐qPCR was applied to detect the relative expression levels of MCM3AP‐AS1 in CRC cell lines. (B) RT‐qPCR was used to detect the knockdown efficiency of three different MCM3AP‐AS1 siRNAs. (C, D) The CCK8 method and colony formation test were used to evaluate the effects of MCM3AP‐AS1 knockdown on cell proliferation. (E) The stable knockdown efficiency of MCM3AP‐AS1 in LoVo cells. (F, G) LoVo cells with MCM3AP‐AS1 stable silencing were injected subcutaneously into nude mice (n = 5) to detect the effect of MCM3AP‐AS1 on tumor formation. The tumor volumes (F) were measured every 3 days because the tumor can be obviously observed and the tumor weight (G) were recorded after sacrifice. *p < 0.05, **p < 0.01, ***p < 0.001.