
FIGURE 4.
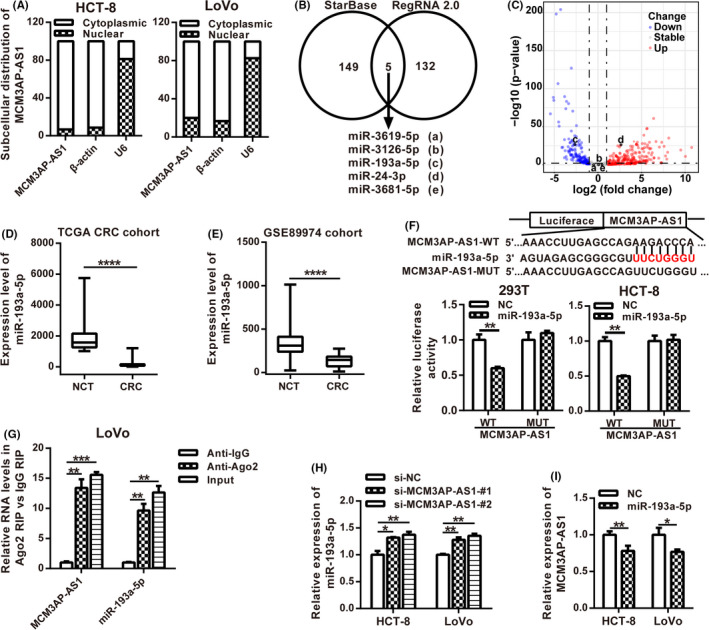
MCM3AP‐AS1 could directly bind to miR‐193a‐5p. (A) Subcellular localization of MCM3AP‐AS1 was detected in HCT‐8 and LoVo cell lines. (B) StarBase and RegRNA 2.0 were used to predict the MCM3AP‐AS1‐associated miRNAs. (C) Volcano maps of differentially expressed miRNAs from TCGA. Differentially expressed miRNAs were distinguished according to |log2 (fold change)| >1.0 and p value <0.05. Red plots represent up‐regulated miRNAs, blue plots stand for down‐regulated miRNAs, and gray plots represent miRNAs with no significant difference. D,E, The RNA expression levels of miR‐193a‐5p of CRC in TCGA database (D) and GEO GSE89974 database (E). (F) The sequence of MCM3AP‐AS1 was cloned into pLuc vector. The relative luciferase activity of MCM3AP‐AS1‐WT or MCM3AP‐AS1‐MUT cotransfected with miR‐193a‐5p mimic was determined by dual luciferase reporter assay. (G) Cellular lysates from LoVo cells were used for RIP with an Ago2 antibody. The levels of MCM3AP‐AS1 and miR‐193a‐5p were detected by RT‐qPCR. (H) The expression level of miR‐193a‐5p was determined in MCM3AP‐AS1‐depleted HCT‐8 and LoVo cells by RT‐qPCR. (I) The expression level of MCM3AP‐AS1 was examined in miR‐193a‐5p overexpression HCT‐8 and LoVo cells by RT‐qPCR. **p < 0.01, ****p < 0.0001.