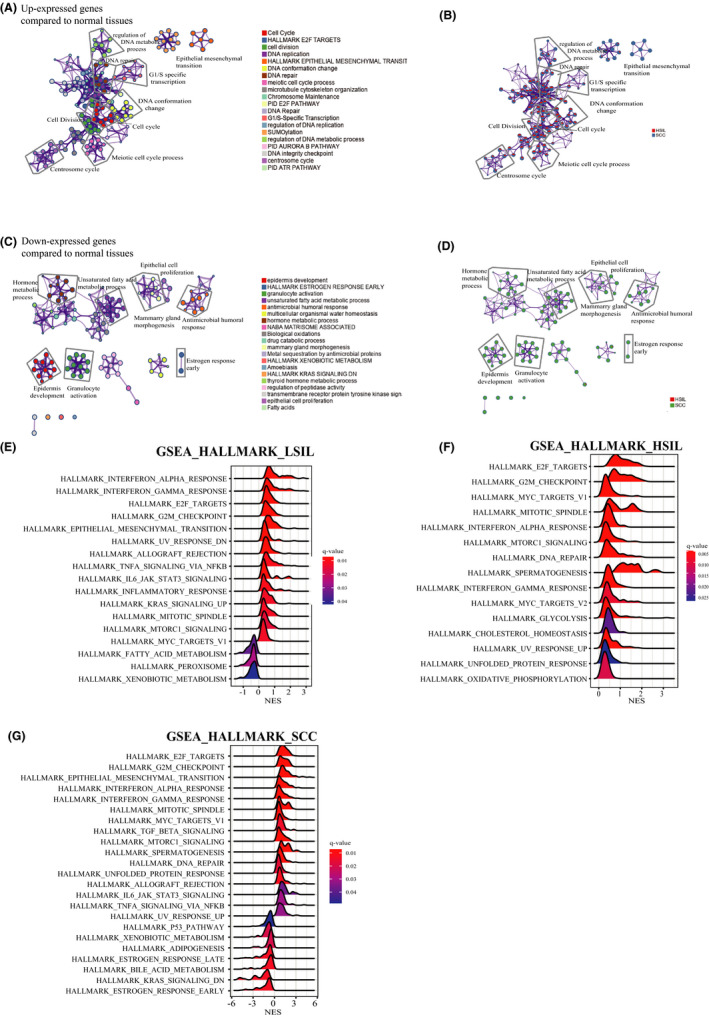
FIGURE 1.

Temporal order of cancer hallmarks during carcinogenesis. (A,B) Network showing the top 30 terms in over‐representation analysis (ORA) of Metascape default pathways between transformed and normal stages, including up‐expressed gene list in (A) and color of pies based on the identities of the gene lists in (B). (C,D) Network showing the top 30 terms in ORA of Metascape default pathways between transformed and normal stages, including downregulated gene list in (C) and color of pies based on the identities of the gene lists in (D). (E–G) Gene sets enrichment analysis (GSEA) plots showing enrichment of the Hallmark pathway in different developmental stages. (E) in low‐grade squamous intraepithelial lesions (LSIL), (F) in high‐grade squamous intraepithelial lesions (HSIL), and (G) in squamous cell carcinoma (SCC)
