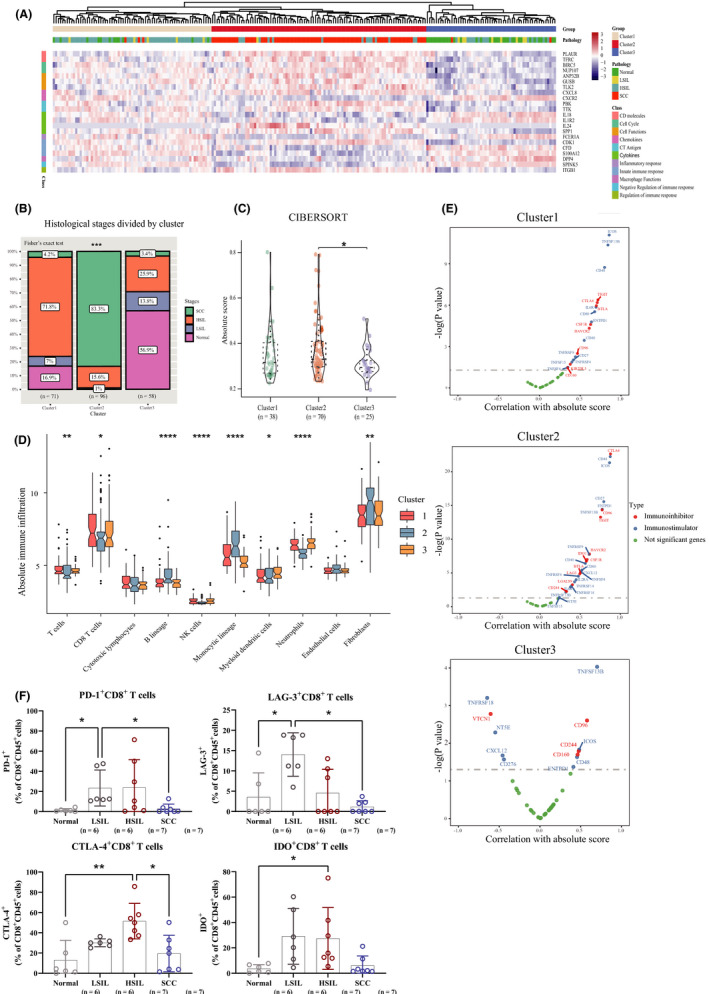
FIGURE 4.

FIIntegration of immune signatures across the progression of cervical disease. (A) Unsupervised hierarchical clustering of cervical disease meta‐cohort revealed three immune subtypes, termed as the immune gene clusters 1–3, respectively. (B) Stacked bar chart showing component differences of histological stages among the three immune phenotypes. Fisher's exact T test. (C) Violin plot showing differences in the absolute score of immune cells among three gene clusters. (D) Box plots showing differences in the abundance of immune cells by the estimation of microenvironment cell populations‐counter among three gene clusters. (E) Spearman's correlation between absolute score and observed expression for immunostimulatory and immunosuppressive interleukins among three gene clusters. Kruskal–Wallis test. (F) Distribution of percentage of immune checkpoint molecules (PD‐1, LAG‐3, CTLA‐4, IDO) on CD8+ T cells in normal cervical tissues and different stages of cervical carcinogenesis. *p < 0.05, **p < 0.01, and ***p < 0.001, and ****p < 0.0001. HSIL, high‐grade squamous intraepithelial lesions; LSIL, low‐grade squamous intraepithelial lesions; SCC, squamous cell carcinoma
