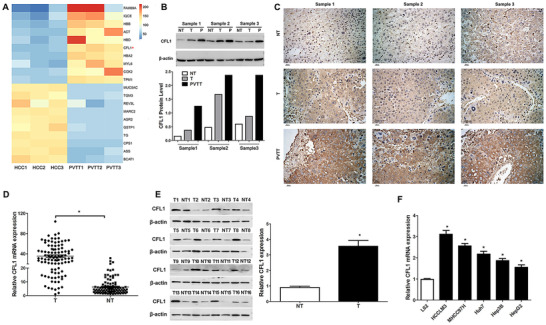
FIGURE 1.

The expression of CFL1 among PVTT, HCC, and adjacent non‐tumour tissues. (A) The heat map of the top ten upregulated/downregulated proteins in PVTT compared to matched HCC tissues. (B) Western blotting analysis of CFL1 was performed among PVTT, HCC, and tumour‐adjacent tissues. (C) IHC staining of CFL1 was performed among PVTT, HCC, and tumour‐adjacent tissues. (D) RT‐qPCR results indicated that CFL1 mRNA expression was significantly higher in HCC than that in tumour‐adjacent tissues. (E) Sixteen pairs of HCC and matched tumour‐adjacent tissues were subjected to immunoblotting for CFL1 expression. (F) The CFL1 mRNA levels in five HCC cell lines (HCCLM3, MHCC97H, Huh7, Hep3B, and HepG2) and a normal hepatic cell line (L02).T: HCC, NT: non‐tumour tissue, P: PVTT. *p < 0.05
