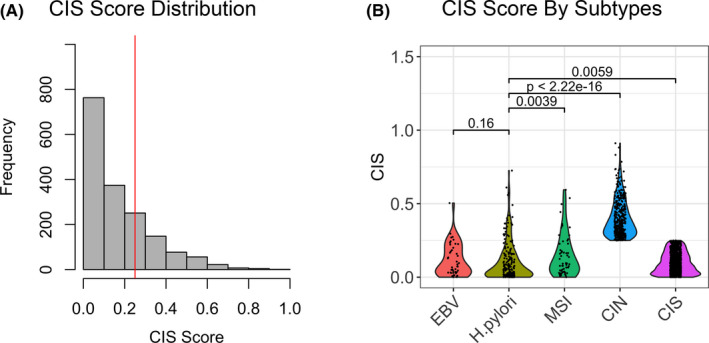
FIGURE 2.

CIS. (A) Distribution of CIS among 1703 tissue samples. The red vertical line denotes top quartile (CIS =0.25). (B) Violin plot of CIS among EBV, H. pylori, MSI, CIN, and GS groups, respectively. There was no difference between EBV and H. pylori groups but the other three groups had significantly higher CIS
