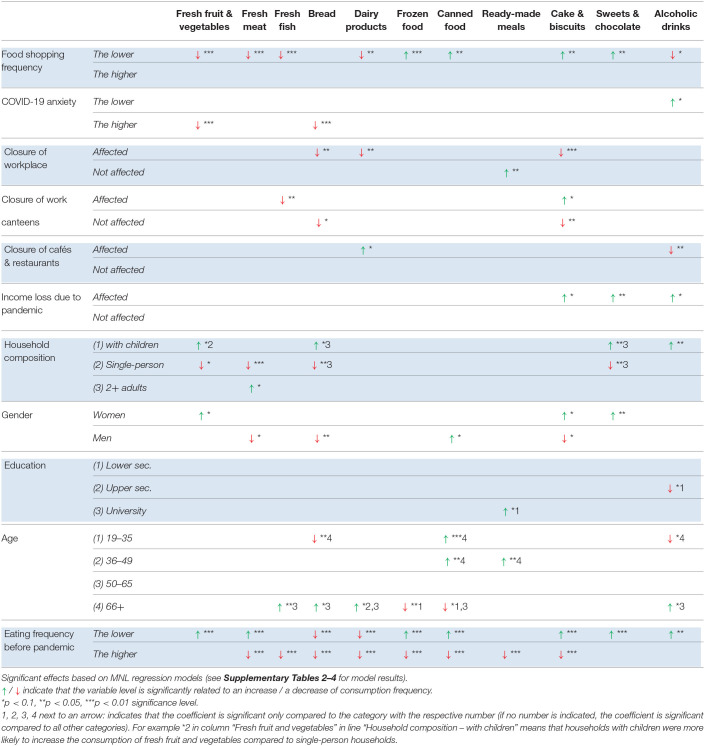
Table 6.
Factors significantly related to changes in food consumption frequency – DENMARK.
Significant effects based on MNL regression models (see Supplementary Tables 2–4 for model results).
/ indicate that the variable level is significantly related to an increase / a decrease of consumption frequency.
*p < 0.1, **p < 0.05, ***p < 0.01 significance level.
1, 2, 3, 4 next to an arrow: indicates that the coefficient is significant only compared to the category with the respective number (if no number is indicated, the coefficient is significant compared to all other categories). For example *2 in column “Fresh fruit and vegetables” in line “Household composition – with children” means that households with children were more likely to increase the consumption of fresh fruit and vegetables compared to single-person households.

