Figure 1.
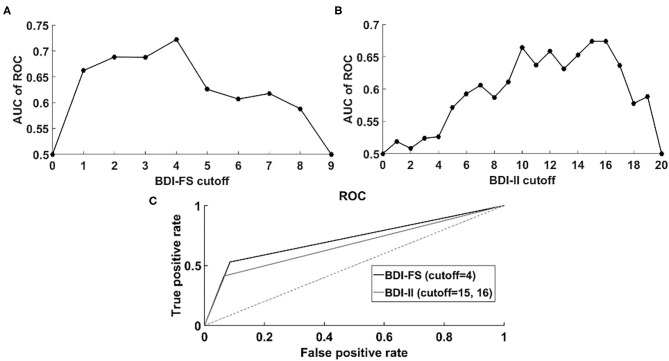
“Area under ROC” (AUC) analysis. (A) AUC of ROC corresponding to BDI-FS across different cutoffs: 0–9. It is noticeable that highest performance is achieved at cutoff = 4; (B) AUC of ROC corresponding to BDI-FS across different cutoffs: 0–20. It is noticeable that highest performance is achieved at cutoff = 15 and 16; (C) ROC of BDI-FS (cutoff = 4) corresponding to logistic regression model: depression-state = 2.4927*BDI-FS −1.6818, p < 0.001 (coefficient and intercept) and ROC of BDI-II (cutoff = 15 and 16) corresponding to logistic regression model: depression-state = 2.3289*BDI-II −1.4816, p = 0.0026 (coefficient), p < 0.001 (intercept). For the considered sample of PD-MCI patients, better performance of BDI-FS than BDI-II was revealed.

