Figure 3.
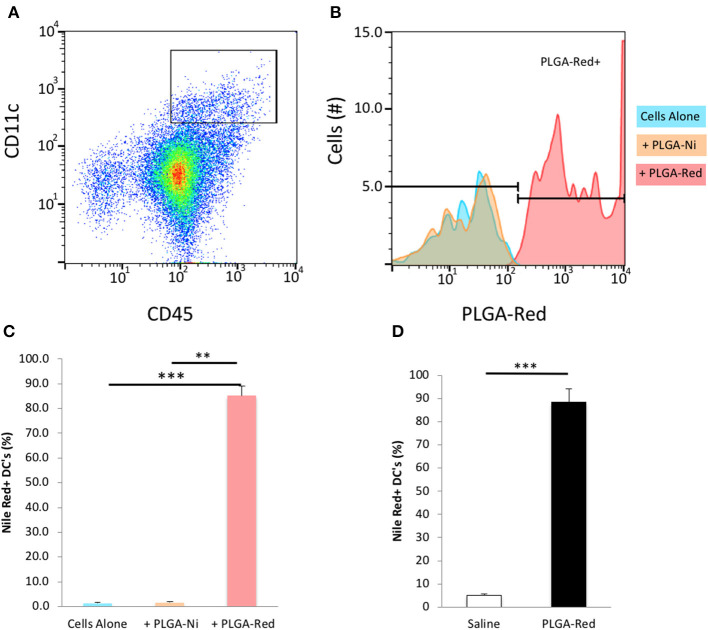
Microparticle uptake by DC in vitro and in vivo. Single cell suspensions of freshly isolated splenocytes were incubated with PLGA-Ni, PLGA-Red, or saline vehicle in vitro for 18 h. (A) Flow cytometry-identified CD45+ CD11c+ splenic DC were evaluated (B) for PLGA-Red microparticle uptake with PE fluorochrome settings. Saline (blue) and PLGA-Ni (orange) treatment populations showed similar PE signal indicating PLGA-Ni alone had low-to-no autofluorescence. PLGA-Red (red) treated DC showed PE signal which when quantified (C) displayed a 85% uptake of microparticles (n = 10 wells). PLGA-Red uptake was significant compared to the other treatment groups (Kruskal-Wallis test) with p-values of 0.0001 (saline vs. PLGA-Red) and 0.0026 (PLGA-Ni vs. PLGA-Red). PLGA-Red particles alone did not exhibit signal in DC marker fluorochrome channels (data not shown). (D) PLGA-Red microparticles were administered subcutaneously in mice and DC were isolated from a 1 cm2 patch of skin 18 h later. DC from the skin patch of PLGA-Red treated animals exhibited a 88.5% uptake of microparticles (n = 5 mice, Student t-test p = 0.0001). Experiments were performed twice in mice from separate NOD cohorts. Statistical significance is designated with ** if p < 0.01 and *** if p = 0.0001.

