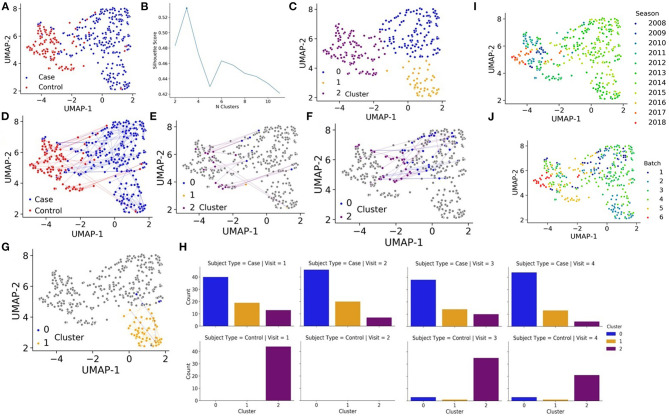
Figure 1.
(A) UMAP projections of all samples collected for the study based on RNA-seq expression where each sample, representing a patient at a specific visit, is colored by cases (blue) vs. controls (red). (B) K-means is fit to the quantile normalized gene counts matrix and silhouette analysis is performed to identify an optimal number of clusters. (C) UMAP projections of all samples collected for the study based on RNA-seq expression where each sample, representing a patient at a specific visit, is colored by automatic cluster assignment. (D) UMAP projections of all samples collected for the study based on RNA-seq expression where each sample, representing a patient at a specific visit, is colored by cases (blue) vs. controls (red) and line trace the trajectory of patients over time. (E) UMAP projections of controls that change clusters (in color), cluster membership (color) and line trace of patients over time. (F) UMAP projections of cases that change clusters from cluster 0 (in color), cluster membership (color) and line trace of patients over time. (G) UMAP projections of cases that change clusters from cluster 1 (in color), cluster membership (color) and line trace of patients over time. (H) Membership of cases (left) and controls (right) for each visit in each automatically detected cluster. (I) UMAP projections of all samples colored by the season/year when the data was collected. (J) UMAP projections of all samples colored by one of six batches.

