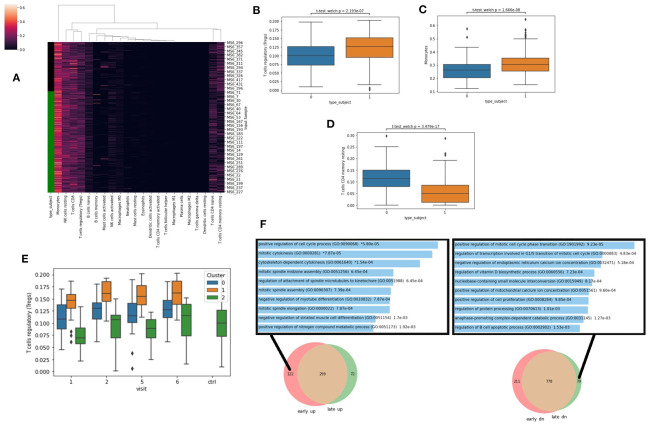
Figure 5.
(A) Cell-type ratios were derived from gene expression with CIBERSORT. Green bar denotes Lyme disease patients. (B–D) Cell-types ratios with significant differences across all visits in healthy patients (type_subject = 0) vs. those with Lyme disease (type_subject = 1) Significance computed with Welch's unequal variance t-test for independence. (E) Predicted levels of Tregs at each visit for each cluster based on CIBERSORT LM22. (F) Comparing the identified DEGs between cases and control and early and late time-points. Enrichment analysis with Enrichr was applied to the unique genes that are only up early (left), or only down (dn) late (right) with the gene ontology biological processes gene set library.

