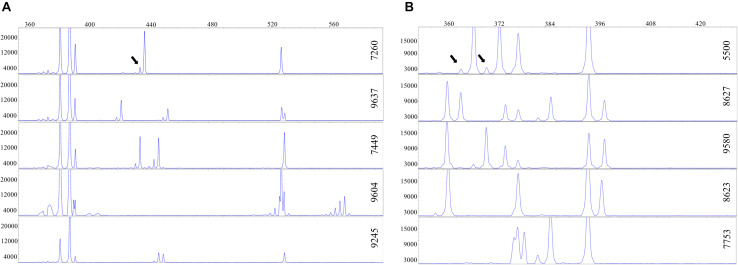
FIGURE 2.
Intraspecific polymorphism in duckweeds, highlighted by capillary electrophoresis. A portion of the electropherogram is shown. The vertical and horizontal axes reflect peak intensity (relative fluorescence units) and peak size (base pairs), respectively. Arrows point to stutter peaks. (A) 1st intron tubulin-based polymorphism (TBP) profiles of five different Landoltia punctata clones. (B) 1st intron TBP profiles of five Lemna minor clones.

