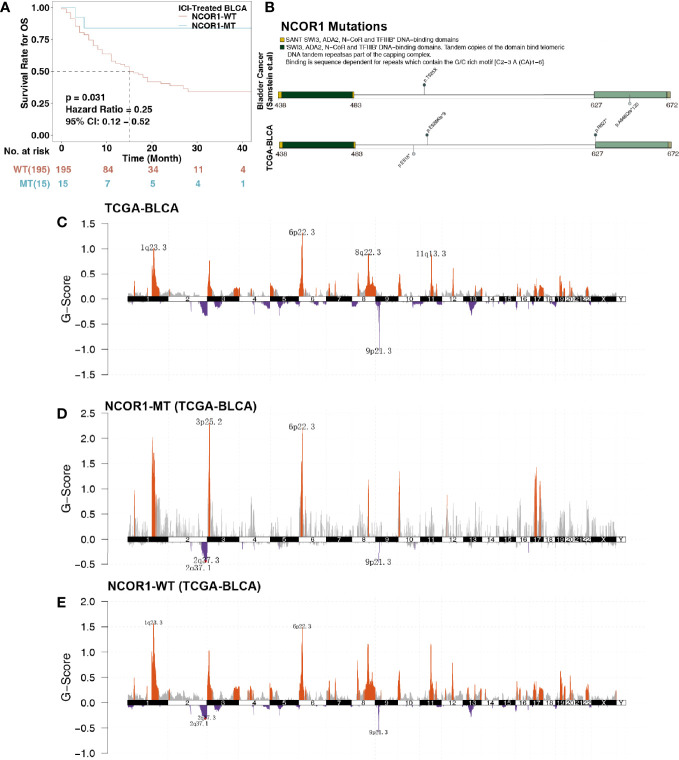
Figure 1.
Survival curves and genetic characteristics of patients with BLCA stratified by NCOR1 status. (A) Kaplan–Meier estimates of OS in the ICI-treated BLCA cohort comparing patients with NCOR1-MT with their respective counterparts without NCOR1-MT. Patients (BLCA) who harbored NCOR1 mutations showed a better prognosis for ICI-based immunotherapy (P < 0.031, log-rank test). (B) Lollipop plot shows the distribution of NCOR1 mutations in the ICI-treated cohort (top panel) and TCGA-BLCA cohort (bottom panel). GISTIC 2.0 analysis showing the most consistent and relevant cytoband alterations in TCGA-BLCA (C), NCOR1-MT (D) and NCOR1-WT (E). The annotated cytobands met the criterion of false discovery rate (FDR) ≤0.05. ICIs, Immune checkpoint inhibitors; OS, overall survival; BLCA, bladder urothelial carcinoma; NCOR1, nuclear receptor corepressor 1; TCGA, The Cancer Genome Atlas; MT, mutant; WT, wild-type.

