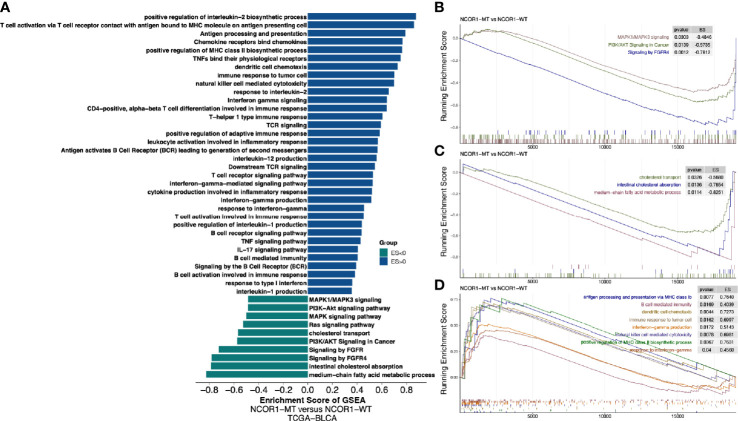
Figure 5.
Transcriptome biological function traits of NCOR1-MT and NCOR1-WT tumors in the TCGA-BLCA cohort. (A) Differences in pathway activities scored by GSEA between NCOR1-MT and NCOR1-WT tumors in the TCGA-BLCA cohort. The enrichment results with significant associations between NCOR1-MT and NCOR1-WT tumors are shown. The blue bar indicates that the ES of the pathway is more than 0, while the green bar indicates that the ES of the pathway is less than 0. (B–D) GSEA of the hallmark gene sets downloaded from MSigDB. All transcripts were ranked by the log2 (fold change) between NCOR1-MT and NCOR1-WT tumors in the TCGA-BLCA cohort. Each run was performed with 1,000 permutations. The enrichment results with significant associations between NCOR1-MT and NCOR1-WT tumors are shown. NCOR1, nuclear receptor corepressor 1; MT, mutant; WT, wild-type; ES, enrichment score; GSEA, gene-set enrichment analysis.

