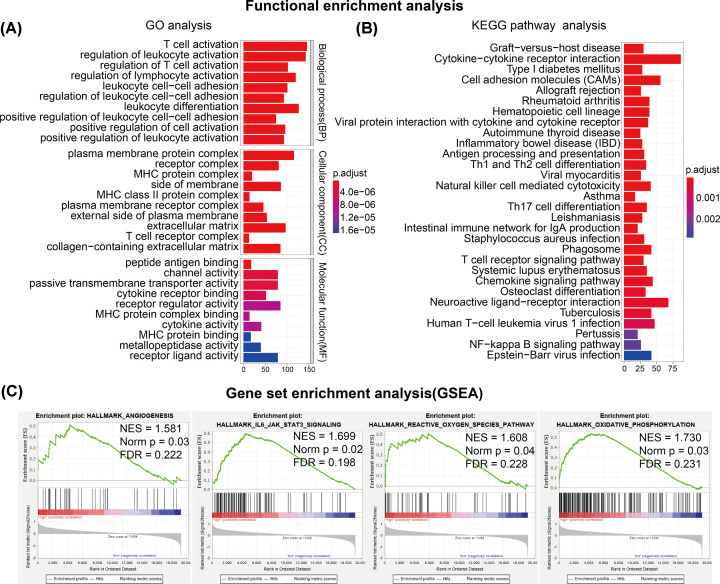
Figure 6. Functional enrichment analysis between low- and high-risk UM patients.
(A) Gene ontology BP (GO-BP) analysis of DEGs between low- and high-risk UM patients in the TCGA cohort. (B) KEGG pathway analysis of DEGs between low- and high-risk UM patients in the TCGA cohort. (C) Gene set enrichment analysis (GSEA) of hallmarks enriched in high-risk UM patients in the TCGA cohort.

