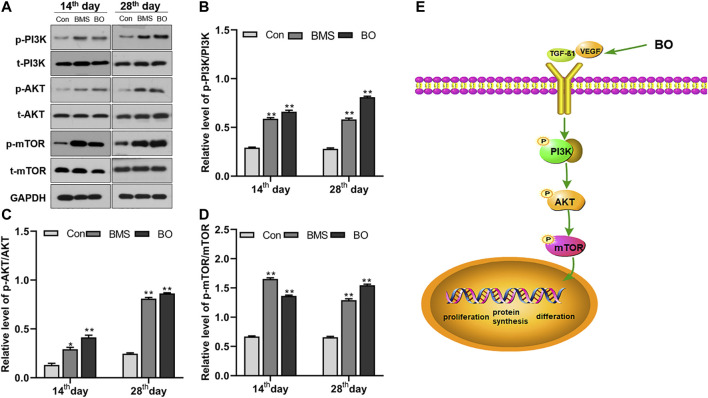
FIGURE 7.
The ;xpression of the PI3K/AKT/mTOR signaling pathway proteins. (A) Representative Western blot bands of relevant proteins. Protein levels of (B) p-PI3K/t-PI3K, (C) p-AKT/t-AKT, and (D) p-mTOR/t-mTOR. Data were presented as the mean ± SEM of three independent experiments. Compared with the control group; *p < 0.05, **p < 0.01, respectively. (E) The illustrated picture of the BO-activated signal pathway within this study.

