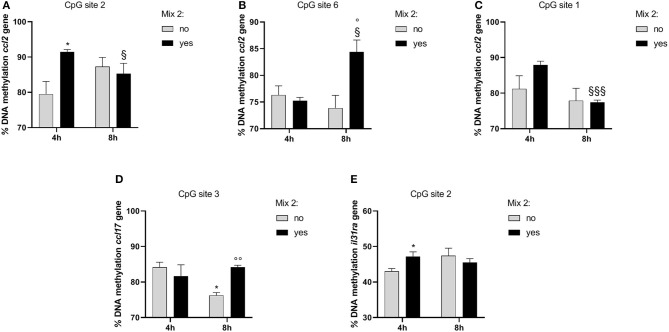
Figure 6.
The effects of the nutraceutical mixture on modulated gene CpG island methylation in DH82 cells. Inflamed cells were treated (Mix yes) or not (Mix no) with nutraceutical mixture (Mix 2) for 4 and 8 h. The bar graphs represent the mean + SEM of three independent experiments performed in triplicate. The figure shows the methylation percentage with respect to ccl2 (A–C), ccl17 (D), and il31ra (E) expressed as methylated cytosine/methylated cytosine + unmethylated cytosine. The statistically significant differences between experimental conditions are reported as follows: *p < 0.05; §p < 0.05, §§§p < 0.001 vs. yes mix 4 h; °p < 0.05, °°p < 0.01 vs. no mix 8 h.

