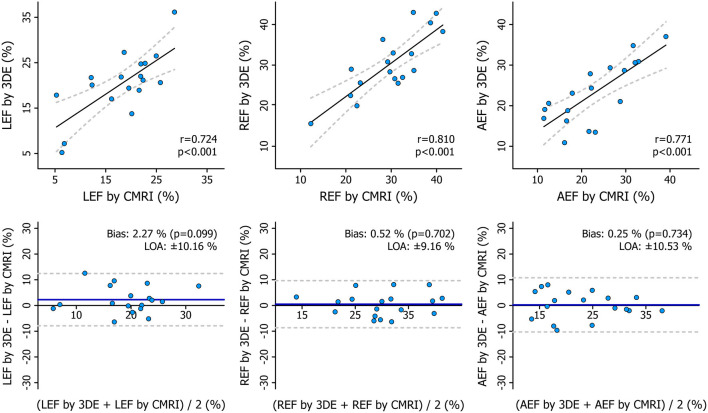
Figure 10.
Correlation and agreement between 3D echocardiography- and cardiac magnetic resonance imaging-derived measurements of right ventricular decomposed ejection fractions depicted by correlation and Bland–Altman plots. Statistical tests: same as in Figure 8. 3DE, 3D echocardiography; AEF, anteroposterior ejection fraction; CMRI, cardiac magnetic resonance imaging; LEF, longitudinal ejection fraction; LOA, limits of agreement; REF, radial ejection fraction.

