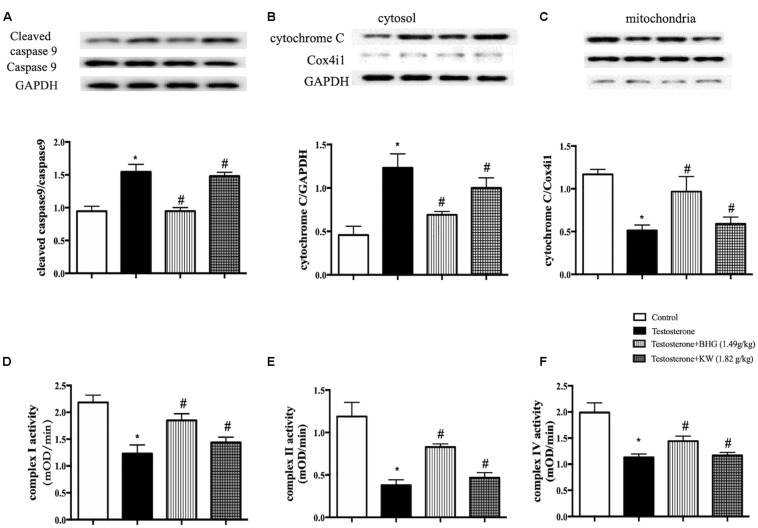
FIGURE 10.
Effect of BHG on the dysfunction in mitochondria of GCs induced by testosterone. (A) Western blot for the expression of cleaved caspase-9 and caspase-9 in different groups with the quantification of cleaved caspase-9/caspase-9 showing below. (B) Representative western blot images of cytochrome C in cytosol form various groups with quantification showing below. (C) Representative western blot images of cytochrome C in mitochondria from various groups with the quantification showing below. GAPDH and Cox4i1 were used as loading control for cytosolic and mitochondrial protein, respectively. (D–F) Statistical results of complex I, II, IV activities of GCs from different groups tested by ELISA. Results are presented as mean ± SEM. *P < 0.05 vs. Control group; #P < 0.05 vs. Testosterone group, n = 3 for western blot and n = 6 for complex activity analysis. Testosterone + BHG (1.49 g/kg) denotes the cells treated with serum from animals receiving BHG at 1.49 g/kg, Testosterone + KW (1.82 g/kg) denotes the cells treated with serum from animals receiving KW at 1.82 g/kg.

