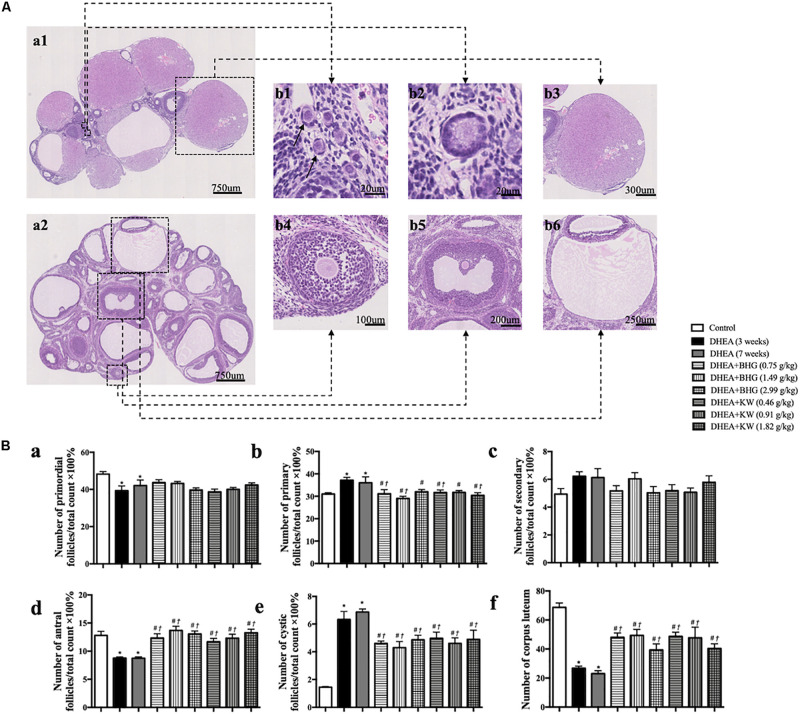
FIGURE 3.
Effect of post-treatment with BHG or KW on follicle development of the ovary. (A) Representative HE stained images of rat ovarian tissue (a1, a2). Shown on right side are the representative images of primordial follicle (b1), primary follicle (b2), secondary follicle (b4), antral follicle (b5), cystic follicle (b6), and corpus luteum (b3), respectively. (B) Statistical result of the percentage of the follicles in different development stages and the number of corpus luteum in various groups. Results are presented as mean ± SEM. *P < 0.05 vs. Control group; #P < 0.05 vs. DHEA (3 weeks) group; †P < 0.05 vs. DHEA (7 weeks) group, n = 15.

