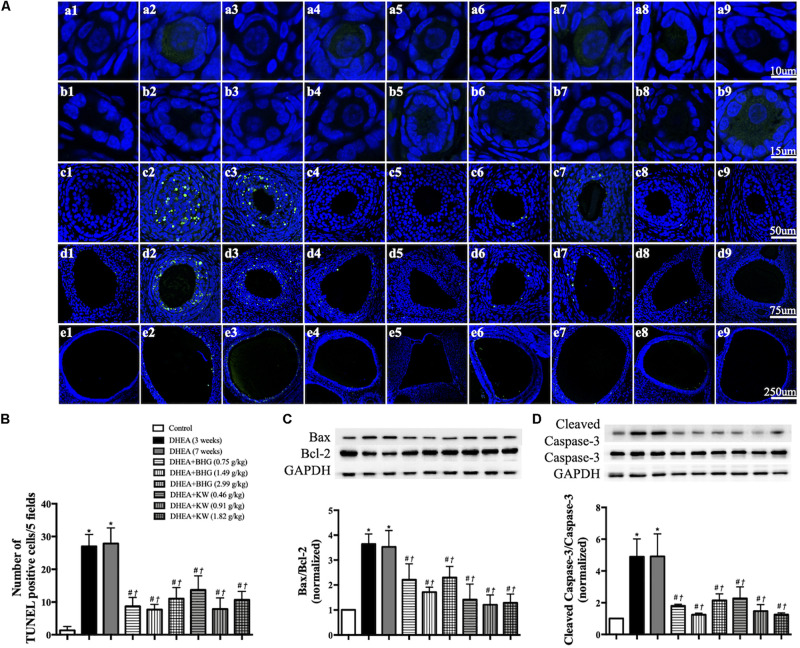
FIGURE 5.
Effect of post-treatment with BHG or KW on apoptosis of granulosa cells in ovarian tissue. (A) Representative TUNEL stained images of primordial follicle (a), primary follicle (b), secondary follicle (c), antral follicle (d), and cystic follicle (e) in Control (1), DHEA (3 weeks) (2), DHEA (7 weeks) (3), DHEA + BHG (0.75 g/kg) (4), DHEA + BHG (1.49 g/kg) (5), DHEA + BHG (2.99 g/kg) (6), DHEA + KW (0.46 g/kg) (7), DHEA + KW (0.91 g/kg) (8), and DHEA + KW (1.82 g/kg) (9), group respectively. TUNEL positive cells are stained green. (B) Statistical result of the number of TUNEL positive cells per five fields in different groups. (C) Western blot for the expression of Bax to Bcl-2 in different groups with the quantification of Bax/Bcl-2 showing below. (D) Western blot for the expression of cleaved caspase-3 and caspase-3 in different groups with the quantification of cleaved caspase-3/caspase-3 showing below. Results are presented as mean ± SEM. *P < 0.05 vs. Control group; #P < 0.05 vs. DHEA (3 weeks) group; †P < 0.05 vs. DHEA (7 weeks) group, n = 3 for TUNEL staining, n = 8 for western blot.

