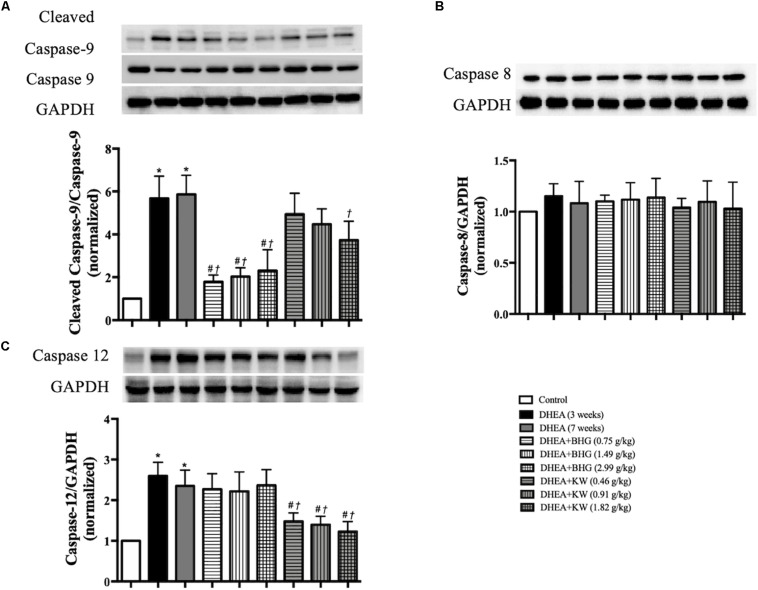
FIGURE 6.
Effect of post-treatment with BHG or KW on the apoptosis pathways. (A) Western blot for the expression of cleaved caspase-9 to caspase-9 in different groups with the quantification of cleaved caspase-9/caspase-9 showing below. (B) Western blot for the expression of caspase-8 in different groups with the quantification of caspase-8 showing below. (C) Western blot for the expression of caspase-12 in different groups with the quantification of caspase-12 showing below. Results are presented as mean ± SEM. *P < 0.05 vs. Control group; #P < 0.05 vs. DHEA (3 weeks) group; †P < 0.05 vs. DHEA (7 weeks) group, n = 8.

