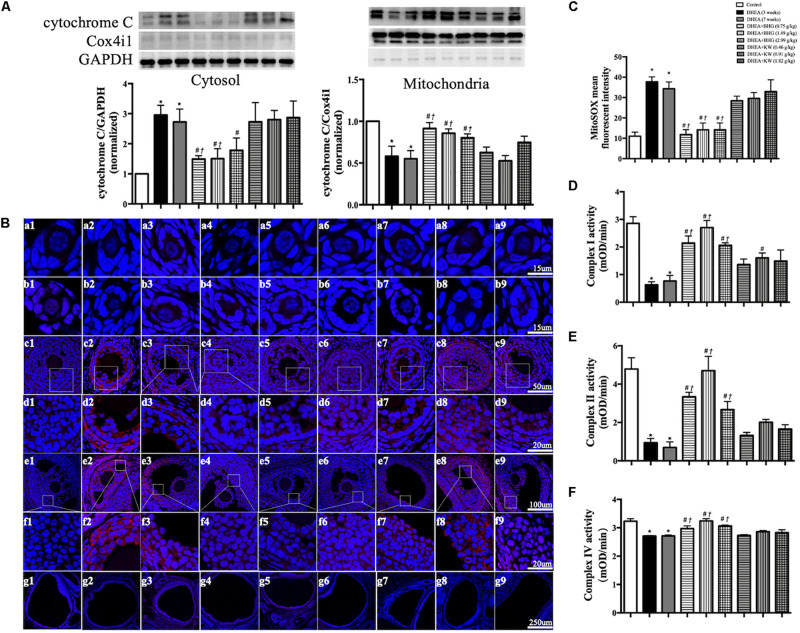
FIGURE 7.
Effect of BHG post-treatment on the dysfunction in mitochondria. (A) Representative immunoblot images of cytochrome C in cytosol and mitochondria with the quantification of cytochrome C/GAPDH and cytochrome C/Cox4i1 showing below. GAPDH and Cox4i1 were used as loading control for cytosolic and mitochondrial protein, respectively. (B) Representative confocal images of MitoSOX staining (red) for mitochondrial ROS production. Shown are primordial follicle (a), primary follicle (b), secondary follicle (c), enlarged images of secondary follicle (d), antral follicle (e), enlarged images of antral follicle (f), and cystic follicle (g) in Control (1), DHEA (3 weeks) (2), DHEA (7 weeks) (3), DHEA + BHG (0.75 g/kg) (4), DHEA + BHG (1.49 g/kg) (5), DHEA + BHG (2.99 g/kg) (6), DHEA + KW (0.46 g/kg) (7), DHEA + KW (0.91 g/kg) (8), and DHEA + KW (1.82 g/kg) (9) group, respectively. Nuclei are stained in blue. (C) Quantification of MitoSOX mean fluorescent intensity in different group. (D–F) Statistical results of complex I, II, IV activities of ovarian tissue from different groups tested by ELISA. Results are presented as mean ± SEM. *P < 0.05 vs. Control group; #P < 0.05 vs. DHEA (3 weeks) group; †P < 0.05 vs. DHEA (7 weeks) group, n = 3 for MitoSOX staining, n = 8 for western blot and complex activity analysis.

