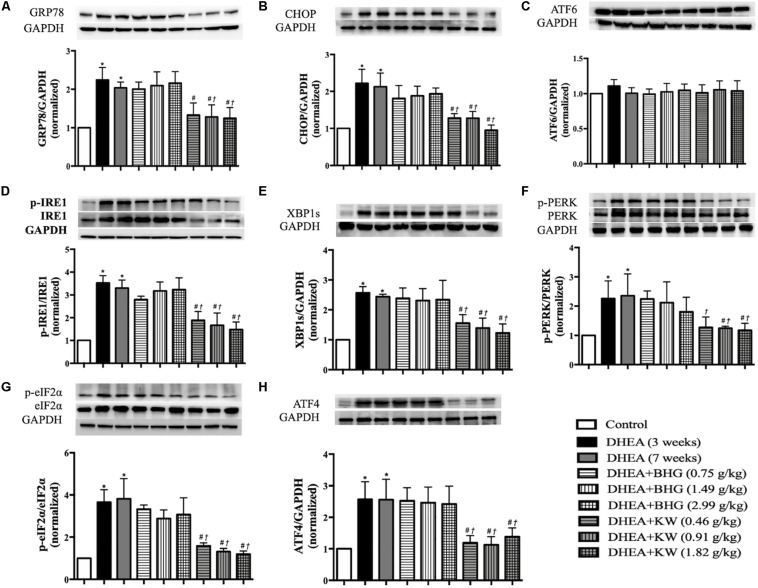
FIGURE 8.
Effect of KW post-treatment on ER stress. (A–H) Presented are the representative western blotting images of GRP78, CHOP, ATF6, phosphorylation-inositol-requiring enzyme 1(p-IRE1), IRE1, XBP1s, phosphorylation-proline-rich receptor-like protein kinase (p-PERK), PERK, phosphorylation- eukaryotic translation initiation factor 2α (p-eIF2α), eIF2α, and ATF4 with the quantification showing below. Results are presented as mean ± SEM. *P < 0.05 vs. Control group; #P < 0.05 vs. DHEA (3 weeks) group; †P < 0.05 vs. DHEA (7 weeks) group, n = 8 for western blot.

