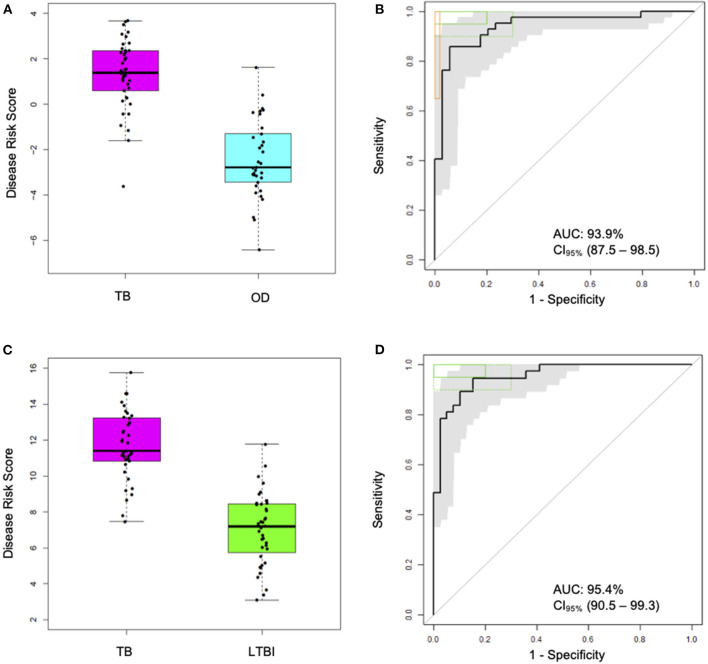
Figure 2.
Classification performance of the FS-PLS-derived four-transcript signatures for TB/OD and three-transcript for TB/LTBI using microarray gene expression data (only test dataset shown). (A) Box plots of DRS and (B) receiver operating characteristic (ROC) curve based on the TB/OD FS-PLS signature applied to the combined HIV ± TB and OD SA/Malawi cohorts (TB DRS vs. OD DRS Mann–Whitney p = 1.33 × 10⁻¹³) (C) Box plots of DRS and (D) ROC curve based on the TB/LTBI FS-PLS signature applied to the combined HIV ± TB and LTBI SA/Malawi cohorts (TB DRS vs. LTBI DRS Mann–Whitney p = 4.92 × 10⁻¹⁵). Gray shaded areas represent the 95% CIs of the ROC curve sensitivities, plotted at 0.5% specificity intervals. ROC curves (B,D) have been benchmarked against target criteria for a tuberculosis triage test (green boxes): Minimum criteria (90% sensitivity, 70% specificity) are indicated by the dashed green boxes and optimum criteria (95% sensitivity, 80% specificity) are indicated by the green solid boxes. The TB vs. OD ROC curve (B) has been benchmarked against the minimum criteria for a confirmatory test (65% sensitivity, 98% specificity) which are indicated by the orange box. AUC, area under the curve; OD, other diseases; LTBI, latent TB infection.

