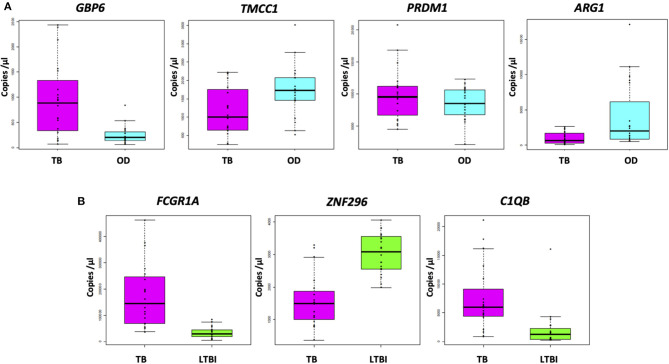
Figure 3.
Absolute quantification of signature transcripts, as determined by RT-dPCR, and according to disease group. (A) TB/OD signature transcripts. Mann–Whitney p: GBP6 3.722 × 10⁻⁴, TMCC1 2.447 × 10⁻², PRDM1 4.612 × 10⁻¹, and ARG1 2.138 × 10⁻³. (B) TB/LTBI signature transcripts. Mann–Whitney p: FCGR1A 1.06 × 10⁻⁷, ZNF296 9.25 × 10⁻⁶, C1QB 9.65 × 10⁻⁶. Transcript concentration is expressed as copies per μL. Culture confirmed TB cases are shown in pink (n TB = 20), OD cases in cyan (n OD = 20), and LTBI individuals in green (n LTBI = 20). OD, other diseases; LTBI, latent TB infection.

